A project portfolio requires contributions from several, sometimes hundreds, of people. Your perspective of your project portfolio team matters. Making one shift can unleash the potential of your team and their ability to contribute to the project portfolio’s success. Organization charts provide quick and reliable insights on who is who and the structure the organization feels it needs to achieve its strategies. They help identify all stakeholders across the organization that are impacted, positively or negatively, by the project portfolio’s result and the path to achieve that result while revealing reporting relationships. All of which help properly establish the project portfolio and ensure its kickoff engages all stakeholders effectively.
Formal organization charts are also not the best way to encourage and establish highly productive teams because they are intended to provide a specific and rather rigid hierarchy that represents only a portion of the organization’s vibrant heartbeat. Informal alliances and lines of communication are usually not represented.
Recommended next step
Find templates, guides, and tools related to project delivery.
Explore Practical PM ResourcesEmpower each team member to bring their best by shifting perspective and creating an informal organization chart that transforms the siloed, hierarchical, rather permanent, triangle-shaped formal organization chart into a circular visual designed to bring clarity to the person’s role on the team and their primary interactions for the life of the project portfolio. This structure helps the project portfolio team thrive and represents the conceptual collaborative home for the team for the duration of their involvement.
To create the project portfolio organization chart, imagine lifting the team completely out of the formal organization chart into a neutral space, perhaps gathering them in a meadow on a warm day, to explain why they are important to the project portfolio’s success, what their primary contributions are, and who they will be interacting with most. The project portfolio organization chart contains the answers to those questions.
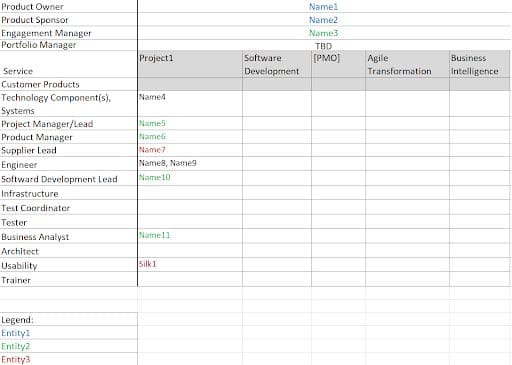
The project portfolio organization chart can take the form of an infographic with the help of a diagramming tool, where lines depict primary communication channels instead of reporting relationships. A simple version can be a tabular visual with roles as row names and projects within the portfolio as column names. Colors can define centers of excellence, employers, or key decision-makers. “TBD” or empty spaces illustrate the shopping list of resources still needed on the team. The result could look something like this:
Recommended next step
Use practical calculators to support project decisions.
Try a Project Calculator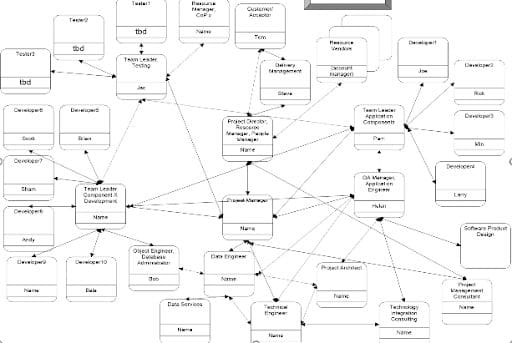
There is more to a person than their job title and who they report to. Formal organizational titles may be the same as the person’s contribution and role on the team. Where they are different from the project portfolio structure, shift from the formal to the informal titles. “VP of Marketing” definitely hints at the level of skill, subject matter expertise, and experience a team member may have; it is likely not as illuminating as “Market Researcher” or “Brand Coordinator” if that is their contribution to the team. Role names that describe the primary contribution expected of that person are the most successful. For example, “Senior Business Analyst” is definitely accurate; “Requirement Maven” or “Product Analyst” may be more revealing.
A project portfolio organization chart does not replace the formal organization chart unless your organization chart is already in a projectized form (which may also be the model of your Project Management Office). Team members will still have the formal organizational reporting relationships and responsibilities; organizational savvy remains an essential element of the project portfolio’s communication plan. Describing a project portfolio team outside the constraints of the formal organization chart is a powerful way to build an effective team.
Tip:
Remember also to leverage the power of project management software like Wrike, Monday.com, Teamwork, Microsoft Project, Asana, and Trello to provide a centralized platform for managing tasks, timelines, and resources. They enable project managers to create schedules, assign tasks, track progress, and collaborate with team members.
Similar Content:
-
Money alone cannot promise project portfolio success
-
The only 2 expectations you need to set for project portfolio success
-
What does portfolio mean?
Recommended next step
Find templates, guides, and tools related to project delivery.
Explore Practical PM Resources