Looking for a way to create a balanced project portfolio? Companies can maximize project benefits and minimize overall project risks by balancing project portfolios. Executives have to analyze and balance the portfolio to reach these goals. The objective is to fund worthy efforts in order to produce the highest payback from each investment. A project portfolio can be considered as an investment fund, where the fund manager tries to create the best investment portfolio by choosing the most appropriate stocks (high-risk stocks and blue-chip stocks) to reach the goal.
Scoring model
A standard scoring model for project selection should consider different factors, here are some of the most relevant:
Recommended next step
Find templates, guides, and tools related to project delivery.
Explore Practical PM Resources- Payback period: shows how long it takes for a business to recover an investment. The number of years needed for the cumulative cash flow to match all cash costs expended prior to the start-up date.
- Strategic alignment: shows how well the program fits with the strategy of the company. Aligning projects with the strategic goals of the company is critical for project success and for obtaining a return on investment.
- Product duration: this is the life of the product in the marketplace expressed in years. How long is the cycle in which the product goes from introduction to withdrawal or eventual dismissal.
- Market opportunity: the probability for the company to satisfy a market need by creating a specific product or service that customers want.
- Level of competition: how strong or intense the competition is. How many competitors are in the market, and which products and services they are offering.
- Level of expertise: the presence of skills within the company to execute the project to create a specific product. Each project requires different types of skills and knowledge.
- Probability of success: the probability of technical and commercial success. Technical success means reaching the goals of a project. While commercial success means achieving a profitable market.
Executives score each factor on a scale of 1-10 per project. Then, these factors are used to create a project attractiveness score. This score is used to make Go/Kill decisions and is also used to rank the order of projects – from best to worst.
It is useful to use visual charts to display the balance in new product project portfolios. These visual representations can include portfolio maps or bubble diagrams.
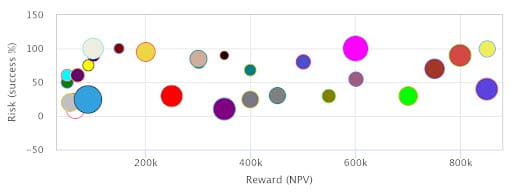
Risk-Reward Charts
The most popular bubble diagram is a variant of the risk-return chart: the risk-reward chart.
One approach is to use a qualitative estimate of rewards, ranging from “modest” to “excellent,” and the probability of overall success (commercial success and technical success). It is important to say that counting too much on financial analysis can do serious damage, especially in the early stages of a project.
Recommended next step
Use practical calculators to support project decisions.
Try a Project CalculatorThe other approach is to rely on a more quantitative and financial measure of reward, namely the probability-adjusted NPV of the project. In this case, the probability of technical success is the vertical axis, as the probability of commercial success has already been built into the NPV calculation (horizontal axis). The size of the bubble indicates a third variable, usually development costs, given the success.
The four quadrants of the portfolio model are:
- Pearls (upper right quadrant): These are the potential star products – projects with a high likelihood of success and that are also expected to yield a very high reward. Most businesses desire more of these.
- Oysters (lower right): These are the long-shot projects – projects with a high expected payoff but with a low likelihood of technical success. They are the projects where technical breakthroughs will pave the way for solid payoffs.
- Bread and Butter (upper left): These are small, simple projects – a high likelihood of success but low reward. They include the many fixes, extensions, modifications, and up-dating projects of which most companies have too many.
- White Elephants (lower left): These are the low probability and low reward projects. Every business has a few white elephants – they inevitably are difficult to kill, and companies should have as few as possible of these types of projects.
Companies that want to grow rapidly need to:
- have few White Elephant projects;
- spend little money on Bread and Butter projects;
- start enough pearls projects that are the ones that can guarantee high rewards;
- assign the right number of resources to all projects, notably to the Oysters.
Project Selection (Risk-Rewards Chart)
The bubble diagram model requires senior management to consider the number of resources needed to execute each project. Basically, if executives decide to add one project to the diagram, they must remove another; or alternatively, they can reduce the number of resources assigned to other projects.
Keep in mind
There are numerous parameters, dimensions, or variables across which one might wish to seek a balance of projects. As a result, there are an endless variety of histograms and pie charts that help to portray the portfolio balance. When using a risk-reward chart, it is important to remember that project bubbles are not static. From one year to the next, a Bread and Butter project may evolve into a White Elephant, and one of your White Elephants may transform into an Oyster. For this reason, it is key to have the ability to look back and compare the data and information contained within the chart from year to year or more frequently.
Similar Content:
-
Leveraging PPM to choose the right projects
-
Why having too many priorities is counterproductive to your top priority
-
How Project Portfolio Management helps companies develop effective strategies
Recommended next step
Find templates, guides, and tools related to project delivery.
Explore Practical PM Resources