
Did you know color plays a key role in visuals and has an impact on color blindness? Do you factor color recognition into reports and presentations? According to the color blind awareness organization, approximately 1 in 12 men and 1 in 200 women, these are the statistics associated with a condition known as color blindness or color vision deficiency (CVD). It is more common than one thinks and it is not discussed in the workplace. Some individuals are actually quite ashamed of having this condition; it can impede their ability to recognize a lot of the color spectrum, often used in business reporting. Others that do not have the condition often disregard it as trivial. It also does not help, that in recent years we have decided to migrate to more graphic, colorful representations of data on projects which brings this more to the surface. Learn how to factor color recognition into reports and presentations.
The impact no color on someone with color blindness
About five years ago, I attended a status meeting with the team, the sponsor, and a few other stakeholders, when the sponsor took me aside and asked to see me in his office. The first thing that came to my mind was: “What have I done now?” but I smiled and followed him in, not quite certain as to why I was being pulled in after what had been a great meeting.
Compare the Best Software for Your Team
Compare Top Software →He had received the weekly report, poured over the dashboard, and still he had issues coming to grips with what we were saying about risks. Closing the door to his office behind him, he hesitantly said: “Could you and I work on some other form of reporting for risks?” At first, I was confused as we had been using this same report for the entire project over the last sixth months and organization-wide for the better part of two to three years. One of my earlier projects in this organization had been to revamp the reporting in different areas, including risk, to make it easier for the reader to understand the information at a glance.
“Is there a problem or some information that you are not getting from the existing report?”, I asked him with somewhat of a look of confusion on my face. He turned bright red, clearly embarrassed, shifting in his chair. He finally said, “I can’t deny it any longer, but I cannot read the report as it is and that makes me feel unprepared for meetings and our discussions.” He continued “I have never really told anyone in the office, but I am color blind.” I was instantly relieved. This was not about me, the project, or the data, it was about him. I could definitely fix this; it just needed some thought and a bit of tweaking to make it work. I asked if I could use him as a test subject and went to work to ensure that the next report would do the trick.
Color Recognition: Making risk information visible to all?
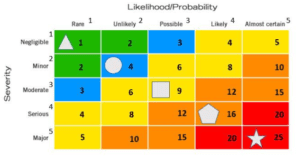
Color has an impact on color blindness, meaning you should factor color recognition into reports and presentations. Have you asked yourself this question before putting a colorful matrix out there for everyone to see? We have already, in most organizations, mastered the use of color but what was needed to bring this up to functional was the addition of “texture.” So how do you add “texture” to a blank page? Here lies the answer, you add shape, color, and definition to your matrix.
A simple risk matrix that would appear as so when I started:
Get Project Management Templates
20+ proven templates to eliminate guesswork and save hours.
Project Management Template Downloads →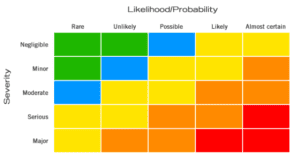
Can now become a multidimensional, representation of risks, making it much easier for any reader to get perspective. You can now change any of the information, scales, and patterns to suit your organization. Most of this, once in place, can easily be automated for your reporting needs. There is also very limited training needed to ensure that everyone is up to speed.
I never realized how prevalent this condition was amongst my colleagues until I started asking the question. Now before I start any project, I make certain to let people know that we are tailoring the information for those that are not able to read it. I actually ask if there are people who have other needs that might need to be addressed. So far, our tweaking worked and made several people more aware of what was going on in projects. As with everything that you take on or try to simplify for the sake of basic understanding, it does not have to be complex to make your life and that of your stakeholders much easier. Just keep it simple. Color blindness has a significant impact on so many, by adding color in reports and presentations it helps to equal the playing field and coveys our interest in being inclusive and fair.
Similar Content:
Compare the Best Software for Your Team
Compare Top Software →Get Project Management Templates
20+ proven templates to eliminate guesswork and save hours.
Project Management Template Downloads →