DMAIC and Six Sigma are key factors in quality management. Having the right tools for quality management is essential. Learn about DMAIC, Six Sigma, and how to apply seven quality management tools to the Six Sigma DMAIC methodology.
There are seven basic quality tools that organizations can utilize for quality management as per the Project Management Body of Knowledge (PMBOK), 6th Edition. The same tools are applicable to the Six Sigma Define, Measure, Analyze, Improve, and Control processes commonly referred to as DMAIC. Below is a description of each of the seven basic quality tools and how they are applicable to the DMAIC methodology.
Cause and effect diagram
Also commonly referred to as the Ishikawa or Fishbone diagram, the tool is used to help identify the possible causes of a specific problem and can also be used hand-in-hand with brainstorming. It shows the relationship between the problems and the influencing factors; thus, it is essential for root cause analyses.
Analyze – The Ishikawa diagram can be used during the Analyze phase to classify root causes in order to simplify prioritization and to better assess them.
Flow chart
A flow chart provides a view of how a company’s workflows can be used to initiate process improvement activities. A flow chart is created using standard symbols and shows the sequence of tasks performed and their relationship in a graphical format.
Define – This phase can be used to understand the process and provide insight into the causes of inefficiency and frustration so that improvements can be made.
Measure – Flow charts created during the Define phase are reviewed, and additional information can be added to make them more comprehensive.
Analyze – An analysis of the process map can reveal some fairly obvious sources of inefficiency and delays in the process.
Improve – A flowchart can be created for the new process that will be followed as a result of the improvements being implemented.
Control – The process map, created during the Improve phase, must be fully analyzed and updated in order to reflect any changes resulting from a rollout.
Pareto chart
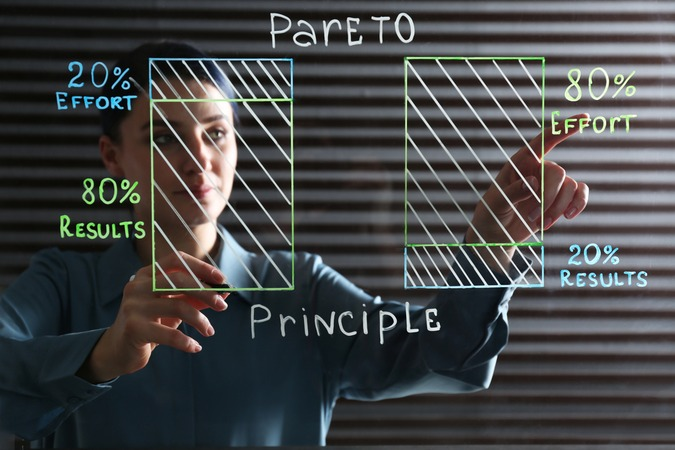
A Pareto chart is based on the Pareto principle, also known as the 80-20 rule or rule of the vital few, which states that a small number of causes (20%) are responsible for a large percentage (80%) of the effects. The graphical display in a Pareto chart is used to display the types of problems that affect a process and their relative significance.
Define – The define phase can be used to decide which problems can be addressed first as part of a six sigma project.
Improve – This phase can be used to identify where the team should focus their continuous improvement efforts.
Histogram
A Histogram is a bar graph that shows data in columns that vary in height depending on the frequency of the occurrence of the data values. It can be used for the visual representation of data collected from other tools – such as check sheets – hence making it easier to interpret where the problems are coming.
Analyze – Can be used to identify variance in the process parameters, as well as predict future process performance.
Check sheet
A check sheet is a simple tool that can be used to record information in real time at a particular location over a period of time. The frequency of problems and defects associated with a particular system can be recorded on a check sheet and can be used to create cause and effect diagrams, Pareto diagrams, scatter diagrams, etc.
Measure – The frequency of data for the items being measured is collected to perform further analysis.
Scatter diagram
A scatter diagram is used to display the values of two variables of a set of data and to make predictions based on the data. It consists of a horizontal axis (X-axis) and a vertical axis (Y-axis), and a series of dots representing the individual X and Y-axis values. A scatter diagram allows the identification of possible relationships between two different sets of variables. This, therefore, can be used to display the correlation.
Analyze – Can be used during the Analyze phase to classify root causes in order to simplify prioritization and to better assess them.
Control chart
A control chart is a statistical tool that differentiates process variations as a result of known causes and variations resulting from unique causes through a graphical display. In a control chart, control limits can be used to monitor process variation so as to come up with the necessary corrective action.
Measure – Determination of which components of variation are inherent in the process (common cause) and which are due to external or specific factors (special cause).
Control – The chart is updated regularly, enabling the process owner to monitor process shifts or any other signs that identify process performance issues.
Improve – Often employed to show the reduction in variations and improvement in performance.
The key to determining which tools are most useful in understanding the impact of any issues and which of the tools is most likely to help clearly uncover the root cause and fully resolve issues.
FAQ’s
What are the 7 basic quality management tools?
The 7 basic quality management tools are: Pareto chart, flowchart, cause-and-effect diagram, check sheet, histogram, scatter diagram, and control chart.
What is Six Sigma DMAIC methodology?
Six Sigma DMAIC (Define, Measure, Analyze, Improve, Control) is a structured problem-solving approach that aims to improve processes and reduce defects or errors.
How can the Pareto chart be applied to the DMAIC methodology?
The Pareto chart can be used in the Define phase to identify the most important factors that contribute to the problem. It can also be used in the Measure phase to prioritize which data to collect and analyze.
How can the flowchart be applied to the DMAIC methodology?
The flowchart can be used in the Define phase to map out the current process and identify potential areas for improvement. It can also be used in the Improve phase to design and test new process improvements.
How can the cause-and-effect diagram be applied to the DMAIC methodology?
The cause-and-effect diagram (also known as fishbone or Ishikawa diagram) can be used in the Analyze phase to identify the root cause(s) of the problem.
How can the check sheet be applied to the DMAIC methodology?
The check sheet can be used in the Measure phase to collect and record data on the frequency or occurrence of defects or errors.
How can the histogram be applied to the DMAIC methodology?
The histogram can be used in the Measure phase to visualize and analyze the distribution of data collected on a specific variable.
How can the scatter diagram be applied to the DMAIC methodology?
The scatter diagram can be used in the Analyze phase to identify possible relationships between two variables and to determine if there is a correlation.
How can the control chart be applied to the DMAIC methodology?
The control chart can be used in the Control phase to monitor and maintain the process improvements that were implemented in the Improve phase. It can also be used to detect any new problems that may arise.
Similar Content:
-
An overview of Six Sigma for business process improvement
-
Tips for selecting the right project management methodology
-
5 Reasons to consider using an agile approach