Many of the project tools available to project managers are simple, yet often, people stop themselves from using them because they might look intimidating or difficult to master. In my experience (with students and, yes, some project stakeholders), decision tree analysis and the decision tree tool provide excellent project results. Let us take a moment to review the decision tree, its use, and how to break it down into five easy steps to get great results all the time with a decision tree diagram and example.
Not that I shy away from complex mathematical problems, but I tend not to like having to confront them. I am not alone in this, as I have noticed in recent years that most of my students and even a few of my project sponsors or stakeholders are also hesitant when it comes to tackling what, at first, looks like a complex mathematical equation. For a lot of people, including myself, a decision tree can look quite daunting. For those of you who are not familiar with decision trees, the diagram on the right is exactly what they look like: branches stemming from nodes breaking down options that are up for decision.
Basic Decision Tree Diagram
They can be very simple or can get more complex as the number of nodes or options increases.
These are common and used widely when performing risk management activities, so for the better part of my life, I have had to generate them, explain them, or analyze them to come up with decisions around my projects. Having to explain them is where I have developed my own set of five steps or rules to use in solving them.
5 Decision Tree Analysis Steps
These five steps of decision tree analysis are of my own creation, and you will not find them documented in any statistics manual. So please, the more expert individuals out there who might be reading this, don’t hate me because I am trying to simplify this to make sense of it better.
We will solve one of these decision trees using five steps/rules, starting with a simple or basic model. I will discuss later some of the more intricate things that might make this not as simple to solve and how to deal with them.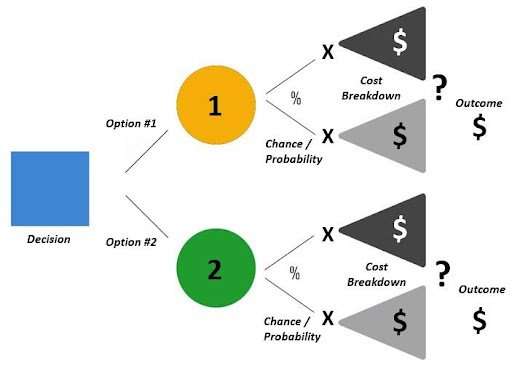
Decision Tree Diagram Example 1
Let us put some data into our decision tree and give it some context.
In the following decision tree analysis diagram, we have a decision (Spring Trip) to make between two options (Paris or London), each of which has a different probability of having good or bad weather during the period that we want to visit. For each situation, we are given a cost breakdown of staying and doing activities during good or bad weather. At the end of this, we would like to know which option is going to be the least costly for us to entertain, considering the probabilities and costs highlighted.
Here’s our model:
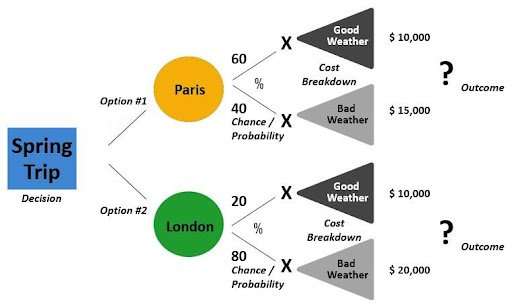
Decision Tree Diagram Example 2
Having reviewed the weather patterns at the time of year, we are anticipating when traveling; we discovered that for Paris, the chances of good weather were 60%, while the chance of having bad weather was 40%. We also were told by a reputable travel agency that the cost of doing activities indoors versus outdoors in Paris increased our cost by $5,000.
In turn, for London, we have good weather chances at 20% while bad weather chances are at 80%, which would impact our cost by $10,000.
Now let us solve this using my five steps/rules:
Step 1
Review the model presented to you. Check for out-of-the-ordinary items that might have been introduced, such as deposits, investments, further probability reductions, etc. These would appear more than likely on the option branches before each of the options. These will need to be taken into consideration and taken out (negative) later as these items are provided ahead of the trip and make a difference in our overall costs. At this point, we need to keep these in mind for use later.
In this model, we do not have any such modifiers.
Step 2
Ensure that our chance/probability node percentages equal 100% for each of our options.
In this case, we are good (60 + 40 and 20 + 80).
Step 3
Review the cost implications to look for negative or positive calculations. A profit and a loss, for example, would give you a positive and a negative value. A word of caution here: it is not always because something “sounds” negative that it might have a negative cost impact. So, in this case, bad weather does not mean instantly a negative value. Look at the values provided to see if a negative is used.
For our model, no negative values are presented.
Step 4
Solve the equation by multiplying the chance/probability by the cost at each of the branches. Once complete, then look for those modifiers we discussed earlier (deposit or investment) and factor those out. All that is left is for you to total each option.
Step 5
Make your decisions based on your data. Looking at our model, it means we would get an outcome of $12,000 for Paris and $18,000 for London. We did not have any modifiers in this model, which means that this is our result. To interpret it, this means that it would be cheaper to travel to Paris by $6,000, taking good and bad weather into consideration during the period that we are investigating.
Here’s the completed model:
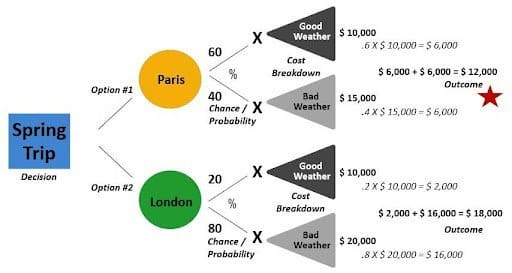
Decision Tree Diagram Example 3
You can see that this simple yet powerful tool can be used to make sense of or put in perspective a great number of situations during our work on projects. The only key is to be able to clearly identify data to factor in and then do the calculations with a proper interpretation of the results. What makes this even more enticeable to a project manager is that this tool is also flexible enough to account for both complex and simple computations. We hope you’ve learned what you expected about decision tree analysis.
Similar Content:
-
How storytelling can help project managers influence stakeholders decisions
-
How can velocity help you determine the probability of project risks
-
Increasing engagement through storytelling: Part 3